Disclaimer
Tracker App by UXAPPS LTD is a personal data tracking and analysis tool that uses standard statistical methods to identify correlations based solely on the data you choose to input. While these correlations can provide valuable insights into potential patterns and relationships in your life, it is important to understand that correlation does not imply causation. A strong correlation between two factors does not necessarily mean that one causes the other, nor that the relationship is meaningful outside of the data provided.
Key Points to Keep in Mind:
- Correlation ≠ Causation. A high correlation simply means two factors tend to vary together, not that one causes the other. Other hidden factors could be at play
- Data Quality Matters. The accuracy and reliability of your insights depend entirely on the accuracy, consistency, and volume of the data you provide. The more complete and precise your data, the more meaningful the results
- No Predictions or Guarantees. The app does not make predictions about the future and should not be considered a replacement for professional advice. Use it as a helpful tool, not a rulebook
- Thoughtful Decisions. While the insights can be helpful as part of a thoughtful, comprehensive decision-making process, they should not be the sole basis for significant life choices. Always consider the broader context
By using this app, you acknowledge that you understand these limitations and agree to use the insights responsibly
Correlation is NOT Causation
Understanding the difference between correlation and causation is one of the most important concepts in data analysis. Let’s break it down in a simple, approachable way.
What is Correlation?
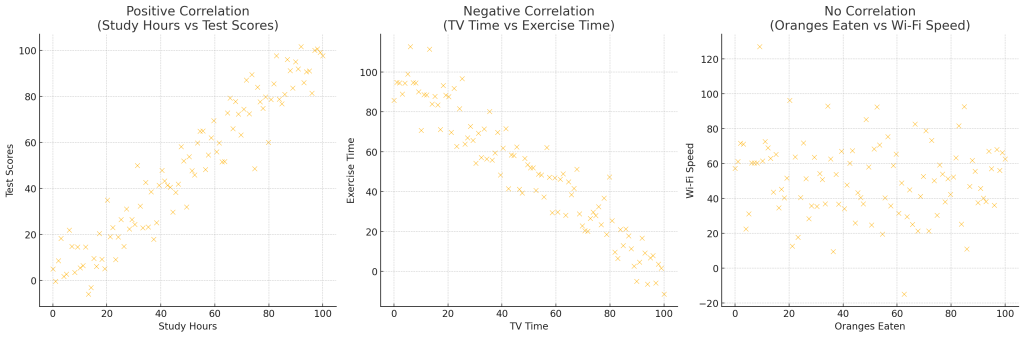
Correlation is a statistical measure that describes how two things are related. It shows whether and how strongly pairs of variables are associated. For example:
- Positive Correlation: As one thing increases, the other tends to increase as well. (e.g., the more hours you study, the better your test scores might be)
- Negative Correlation: As one thing increases, the other tends to decrease. (e.g., the more time you spend watching TV, the less time you have for exercise)
- No Correlation: Sometimes, two things are just not related at all. (e.g., the number of oranges eaten and your Wi-Fi speed)
But Correlation is NOT Causation
Just because two things seem to be related doesn’t mean one is causing the other. This is a common misunderstanding. Here’s why:
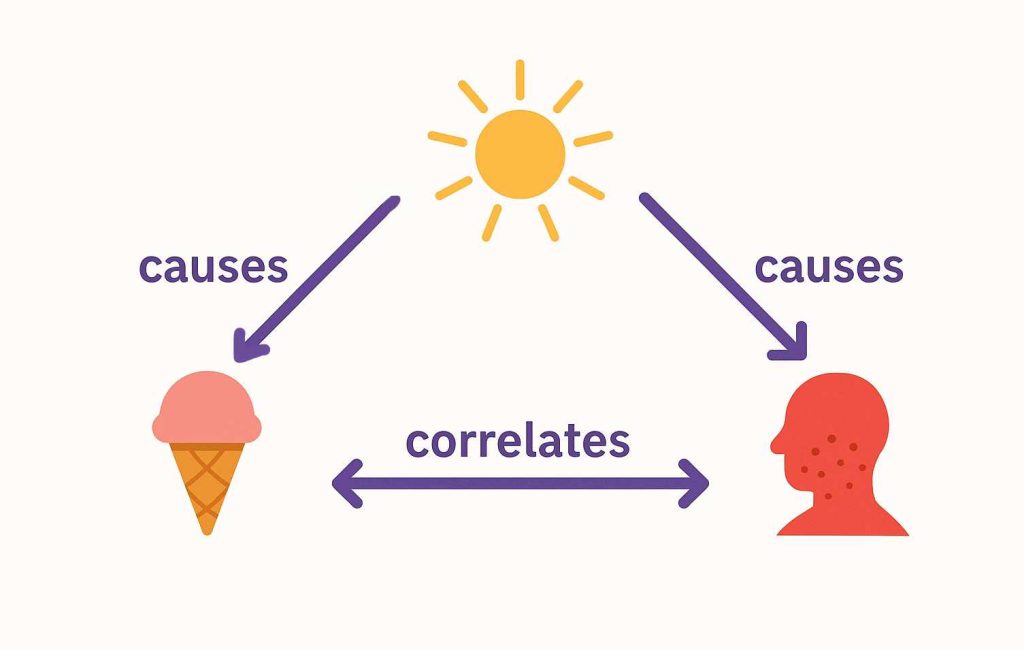
Example 1: Ice Cream and Sunburn
Research might show that on days when more ice cream is sold, more people also get sunburned. Does this mean ice cream causes sunburn? Of course not. The real cause is the hot weather, which leads to more sun exposure and more ice cream consumption.
Example 2: Coffee and Productivity
Imagine you track your coffee intake and productivity and find a positive correlation. This might make you think that coffee directly causes higher productivity. But maybe the real cause is that you drink coffee on busy workdays when you are already more focused.
The Third Variable Problem
Often, a third, hidden factor is influencing both things. This is known as a confounding variable. For example, the amount of sunshine might be the hidden factor influencing both ice cream sales and sunburns.
When you use our app to track and find patterns in your data, it’s essential to keep this in mind. Correlation can reveal interesting insights, but it’s not the whole story. Always think critically about what might be influencing the patterns you see